OVERVIEW AND SUMMARY
In recent years, the Ghanaian economy has faced a series of challenges, ranging from the widespread and unprecedented effects of COVID-19 to the global economic repercussions stemming from the Russian-Ukraine conflict, which have significantly impacted the Ghanaian financial landscape.
These dual phenomena, characterized by their substantial financial implications, have exacerbated economic strains within the country, leading to a surge in inflation rates. Consequently, the increasing financial burden on the nation necessitated external borrowing to bolster the economy and mitigate the overwhelming inflation pressures. In the pursuit of securing this much-needed external support, a debt restructuring process was initiated.
However, this restructuring effort, intended to provide financial relief, exacerbated the economic hardship experienced by the entire nation and adversely affected businesses across various industries. Notably, the rise of the monetary policy rate by the Bank of Ghana, made it increasingly challenging for companies to secure the necessary funding for their operations.
Amidst these turbulent times, the Ghana Stock Exchange (GSE) has experienced notable ups and downs, leaving investors cautious. However, a closer examination of the stock market reveals a glimmer of hope, with a selection of top-performing companies defying the odds. The Ghana Stock Exchange (GSE), as the primary equity market of the nation, has mirrored the broader turbulence of the economy. Over the past decade, investors have embarked on a rollercoaster ride of unpredictable market fluctuations. Yet, amid this volatility, there are companies that not only survived but thrived.
To identify these resilient companies, meticulous analysis was conducted over a ten-year period, spanning from 2013 to 2022. The primary focus was on year-on-year stock price appreciation, with the aim of identifying firms with a consistent pattern of annual stock price increases. The top 10 companies that emerged from this analysis demonstrated resilience and a consistent upward trajectory. Recognizing that performance can change over time, a subsequent analysis was performed, focusing on the past five years from 2018 to 2022. This period captured companies that exhibited sustained growth in a more recent, and perhaps even more challenging, economic environment.
Interestingly, while some of the top performers from the ten-year analysis slipped out of the top rankings in the five-year analysis, four companies managed to maintain their impressive performance over both periods. These companies, namely BOPP, GCB, GGBL, and GOIL, stand out as the top performers in the Ghana Stock Exchange, weathering economic hardships. The consistent upward trajectory of these four top-performing companies presents an opportunity for investors to capitalize on potential gains. Although economic hardships have tested the resilience of the Ghanaian economy, the careful curation of an optimal portfolio mix is crucial in this scenario. By strategically selecting assets that balance risk and reward, investors can position themselves to leverage the ongoing positive market dynamics.
Methods:
In this note, we investigate the performance of all 38 firms listed on the stock market based on year-on-year stock price appreciation from 2013 to 2022. Subsequently, we narrowed it down by selecting the top 10 indices and then the top 4 indices over the period under review. Specifically, we first compute stock price returns based on year-on-year price changes of the top 10 selected indices. This process unfolded in two distinct phases. Initially, we calculated stock price returns by examining the year-on-year price changes of the top 10 selected indices.
This initial examination revealed that certain firms had excelled during the first half of the 10-year analysis, spanning from 2013 to 2018, but their performance waned in the latter five years, encompassing 2018 to 2022. To bridge this performance gap and identify companies with consistent and sustained performance, we proceeded to conduct a supplementary analysis. This subsequent analysis was based on a focused 5-year period, from 2018 to 2022. Through this refined analysis, we further distilled the list by selecting the four firms that demonstrated unwavering performance. These companies not only appeared among the top performers in the 10-year analysis but also maintained their remarkable year-on-year returns to investors in the 5-year period analysis.
Data and Summary Statistics:
We collected data on the indices from the Ghana stock exchange market, the annual Report Ghana, the African stock market, and Simply Wall Street. For the Price analysis and shares outstanding, we used the share prices of the Ghana Stock Exchange (GSE). For the profitability analysis and valuation projections, we utilized data (financial statements) from the annual report of Ghana and the African Stock Market. Lastly, for the rates in the valuation, we employed some data from Simply Wall Street, while other rates were manually computed using various models.

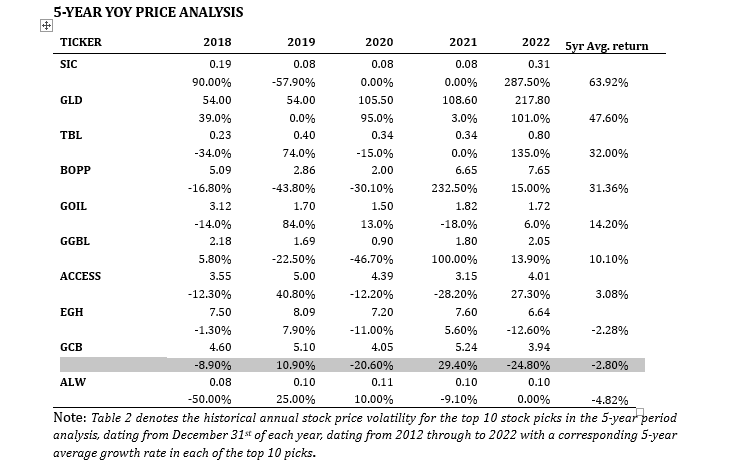

YoY GROWTH IN SHARE PRICES OF THE TOP 4
The 5-year and 10-year analytical timeframe showed that among the top ten stock picks in both periods under review, BOPP, GCB, GGBL, and GOIL emerged consistently as the best in both periods. Moreover, we will dive a bit further into their historical performance.

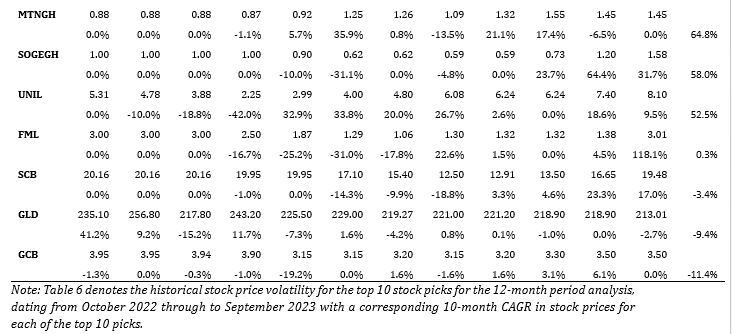
Note: Table 4 denotes the 5-year annual stock price volatility for the top 4 stock picks, consistently appearing among the top 10 in the 5-year and the 10-year period analysis, dating from 2018 through to 2022 with a corresponding 10-year average growth rate and CAGR of prices in each of the top 4picks.
There were many inconsistencies among the top 10 picks due to changes in market dynamics, company-specific developments, and economic conditions. BOPP, GCB, GGBL, and GOIL exhibited remarkable growth in the market, withstanding various internal and external factors, such as high policy rates, a higher tax burden, and galloping inflation over the period. They returned massive income to their investors amid the difficulties. This highlights the importance of ongoing analysis to adapt to changing market conditions.
Each of these companies operates in sectors with diverse and resilient demand. BOPP benefits from its involvement in the agriculture sector, specifically palm oil production, which demonstrated consistent growth over the years. GCB, as a leading bank, provided essential financial services that were indispensable to the economy. GGBL leveraged a strong brand presence and continued demand for alcoholic and non-alcoholic beverages. GOIL's role in the energy sector, particularly in providing fuel and lubricants, ensured a steady demand.
Analysis reveals that these indices have consistently outperformed their peers due to their diversified portfolios, adaptive strategies, effective risk management, and strong market positioning. This analysis underscores the importance of not only identifying top performers but also understanding the factors driving their success. Investors can draw valuable lessons from these consistently top-performing stocks and apply the insights gained to make informed investment decisions in an ever-evolving market environment. Additionally, the findings emphasize the necessity of ongoing analysis and adaptability to respond to changes in market conditions and maintain a resilient investment portfolio.
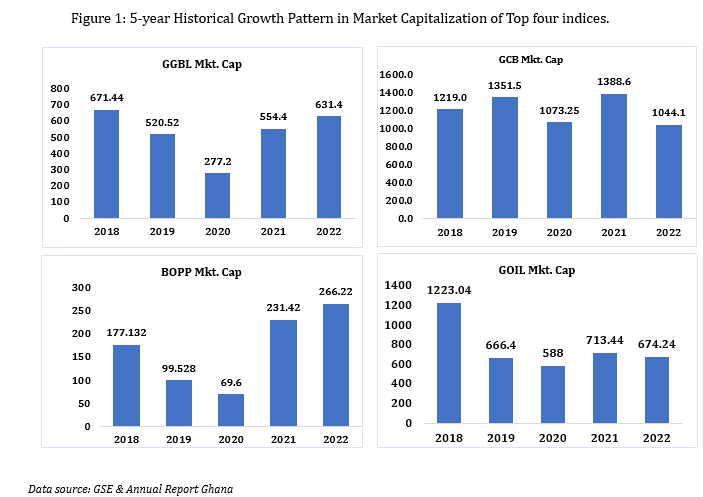
The graph reveals a substantial increase in market capitalization from 2018 to 2022. BOPP's market cap nearly tripled during this period. GCB experienced fluctuations over the five-year period. Despite some peaks and valleys, the bank maintained a strong market capitalization throughout. This suggests resilience and stability in the banking sector. GOIL's market capitalization showed a degree of volatility during the period. While there were significant fluctuations, it ended the five-year period with a relatively stable market cap. GGBL exhibited fluctuations, with a dip in 2020 due to COVID-19, dragging the share price to year low and a subsequent rise in the following years. The volatility is due to the dynamics of the alcoholic beverage industry and external factors affecting consumer behavior.
Micro Economic outlook for the period under review.
Even though the top 4 picks operate in different sectors, they were all affected by the factors that drove the economy. For instance, in 2020, Ghana cedi depreciated against the major currencies recording a cumulative depreciation of 3.9 percent against the US dollar, compared with 12.9 percent in the prior year, 2019. The Ghana cedi rate to the US dollar depreciated from GH¢5.73: $1 in December 2019 to close at GH¢5.89: $1 in December 2020.
Interest rates on the money market broadly showed downward trends across the yield curve. The 91-day declined to 14.1 percent in December 2020 from 14.7 percent in 2019, and the 182-day Treasury bill rate fell to 14.1 percent from 15.2 percent over the same comparative period. On the secondary bond market, yields on 6-year, 7-year, 10-year, and 15-year bonds all declined. The rates on the 20-year bond, however, inched up marginally to 22.3 percent in December 2020 relative to 22.1 percent in December 2019.
Moreover, in 2020, the Ghanaian economy coupled with the COVID–19 pandemic significantly curtailed economic growth momentum. Real GDP growth was estimated to decelerate from 6.5 percent in 2019 to 1.7 percent in 2020, due to the slump in oil prices and weakened global economic activity.
The COVID-19 pandemic and its subsequent disruptions of the social and economic fabric of the country continue to be felt today. The Russia-Ukraine war has disrupted the shipping of raw materials for production across the world and its impact on Ghanaian business cannot be overemphasized. Even now the Ghanaian cedi is performing poorly against other trading currencies over the last year and its resultant impact is exemplified in the record number of times commodities within the country must be priced.

Data source: GSE & Annual Report
GGBL faced many challenges, resulting in a 27% decline in net income in 2013. In 2014, the company suffered from foreign exchange differences and payment of interest on intercompany loans which resulted in a 147% drop in profitability in the year. Administrative expenses in 2015 more than doubled from the previous year, leading to a substantial decrease in net income by 427%. Moreover, in 2019, deferred taxes and rising staff costs contributed to an 83% decline in net income. The net foreign exchange loss in 2020 led to a 190% decrease and subsequently in 2022, recorded a further decline of 24%, driven by rising costs of sales, administrative expenses, and finance costs.
On the other hand, a net loss from a change in the fair value of biological assets led to a decline in the net income of BOPP by 33.7% in 2015 and subsequently falling by 45% in 2018 which is attributable to the decline in the growth rate of revenue compared to previous years. Moreover, after the decline in those years, it subsequently recorded further increases, recording a 274% increase in net income in 2021 and a further increase of 73.5% in 2022.
GCB over the years experienced fluctuating trends within the same period, reflecting various internal and external factors. A substantial 60% growth in 2013 marked a strong start, followed by a 23% increase in profitability in 2014. In 2015, net income declined by 10% due to a rise in depreciation and amortization, and rising personnel expenses. The company rebounded in 2016 with a 25% increase, only to face a 26% dip in 2017, driven by a surge in losses on negotiated loans. GCB recovered with a 39% growth in 2018 and a 31% increase in 2019. However, it further recorded a 4% increase in 2020 and 28% in 2021 followed by a significant 204% decline in 2022 which is directly attributed to a net impairment loss on investment securities and escalating personnel expenses.
Moreover, GOIL showcased a generally positive trend in net income, with growth rates ranging from 9% to an impressive 96%. The company started strong with a 46% growth in 2013, followed by consistent growth rates of 47% and 36% in 2014 and 2015, respectively. Despite this challenge, the company continued to demonstrate resilience, with growth rates of 21% in 2016 and 26% in 2017. A 29% increase in 2018 and 15% in 2019 suggested a steady upward trajectory. However, a 9% increase in 2021 and 25% in 2022 indicated ongoing stability. In 2020, the impact of the COVID-19 pandemic led to a slowdown as revenue growth fell, affecting the bottom line. Notably, the dip in 2020 is attributed to the pandemic's effects on revenue and increased administrative expenses associated with donations and corporate social responsibility, showcasing GOIL's adaptability and commitment to maintaining a strong financial position.
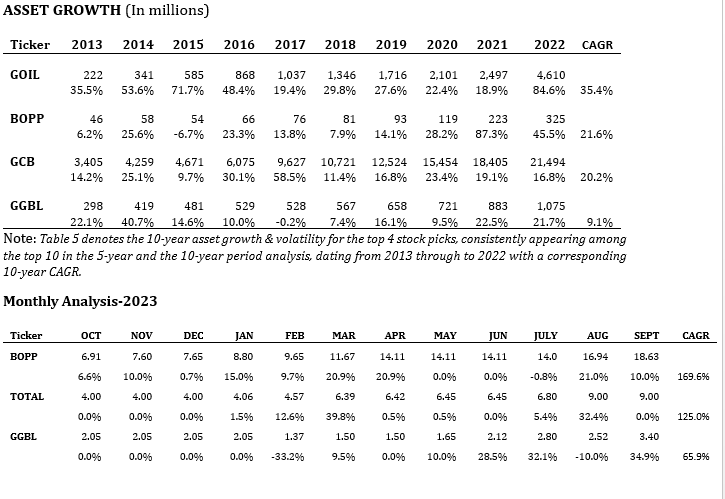
(PERSONAL ANALYSIS & VALUATION)
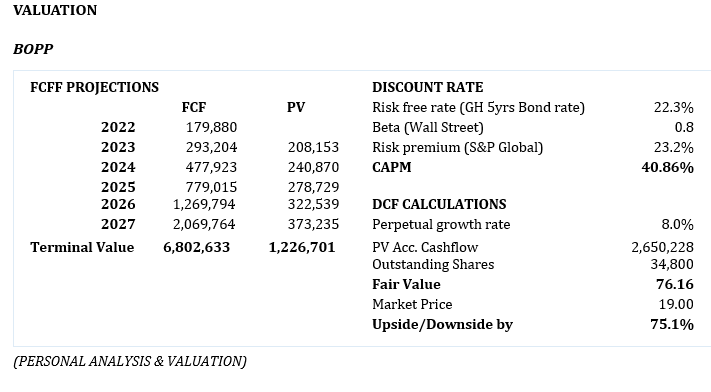
Applying a discount rate of 40.87%, calculated using the Capital Asset Pricing Model, we obtain a present value of these cash flows equal to GHS2.6 billion, giving us an intrinsic value per share of GHS 76.16. This leaves an undervaluation of 75.1 percent compared to the current market price of GHS 19.00.
GCB: Using the Excess Return Model and applying a Cost of Equity rate of 34.51%, calculated using the CAPM, the analyst obtains a book value per share of GHS 7.95 and a Terminal value of excess returns of GHS – 4.21, we arrive at a fair value of GHS 3.74 for GCB. Compared to the current price of GHs3.51, GCB is undervalued by 6.3 percent. Source: Simply Wall Street.
GGBL: Applying a discount rate of 28.26%, calculated using the CAPM, analyst obtained that the present value of 10-year future cashflow is GHS 6.87 billion or GHS 22.34 per share in the DCF model. Moreover, compared to the current market price of GGBL, the share price is undervalued by 84.8 percent. Source: Simply Wall Street.
GOIL: Similarly, using the DCF model, analysts obtain a present value of a 10-year future cash flow of GHS 224.34 million at a discount rate of 41.44 percent. With an outstanding share of about 392 million, the intrinsic value was calculated to be GHS 0.57. Compared to the current market price per share of GHS 1.50, GOIL, however, is overvalued by 162 percent. Source: Simply Wall Street.
Conclusion
Despite the challenging economic landscape and its various tribulations, Ghana's stock market has showcased resilience through the performance of these and many other top-performing companies. Looking ahead, this consistent upward trajectory presents an opportunity for investors to capitalize on potential gains. Investors can harness this potential for greater returns by making informed and strategic investment decisions. The careful curation of an optimal portfolio mix is crucial in this scenario. By strategically selecting a combination of assets that balance risk and reward, investors can position themselves to leverage the ongoing positive market dynamics. In an uncertain economic environment, there is indeed an opportunity for astute investors to navigate the storm and achieve financial success.
Latest Stories
-
‘This is a new administration’ – Dr Pelpuo urges nurses to reconsider strike tactics
24 minutes -
Striking nurses did not create opportunity to talk – Labour Minister tells Joy News
53 minutes -
‘We are more than shocked’ – Labour Minister worried over nurses’ strike without consultation
1 hour -
RFK Jr sacks entire US vaccine committee
2 hours -
Telecel Ghana plants 10,000 additional trees at Chipa Forest Reserve on World Environment Day
5 hours -
Man City sign Wolves defender Ait-Nouri for £31m
5 hours -
Inter appoint Parma boss Chivu as manager
5 hours -
Rev. Francis Kobla Nani De-Souza
5 hours -
Judge dismisses Justin Baldoni’s $400m defamation lawsuit against Blake Lively
6 hours -
Protest hits Kenya after shock death of man held by police
6 hours -
Satellite installer remanded in custody for defiling 3 girls
6 hours -
Car loaded with alleged parcels of Indian Hemp involved in accident at Akatsi
6 hours -
Two washing bay attendants jailed for vehicle theft
6 hours -
Cedi comes under some pressure; one dollar equals GH¢11.60
6 hours -
WHO extends health emergency for mpox as cases climb in West Africa
7 hours

